Met Office Leicester: live forecast or historical temperature benchmark?
Get the official Met Office Leicester forecast and warning details, then compare with November averages and past temperature extremes to understand what Leicester weather can feel like.

For today’s weather, use the official Met Office Leicester forecast. The historical figures below are from Open-Meteo.com (ERA5, Copernicus), not the Met Office, and should not be read as current conditions or warnings.
Leicester forecast and weather warnings
Check the forecast’s update time and selected date before planning a journey. Use the official Leicester warnings page for warning details. For the football location, select the separate Leicester City F.C. forecast.
November averages and the seasonal turning point
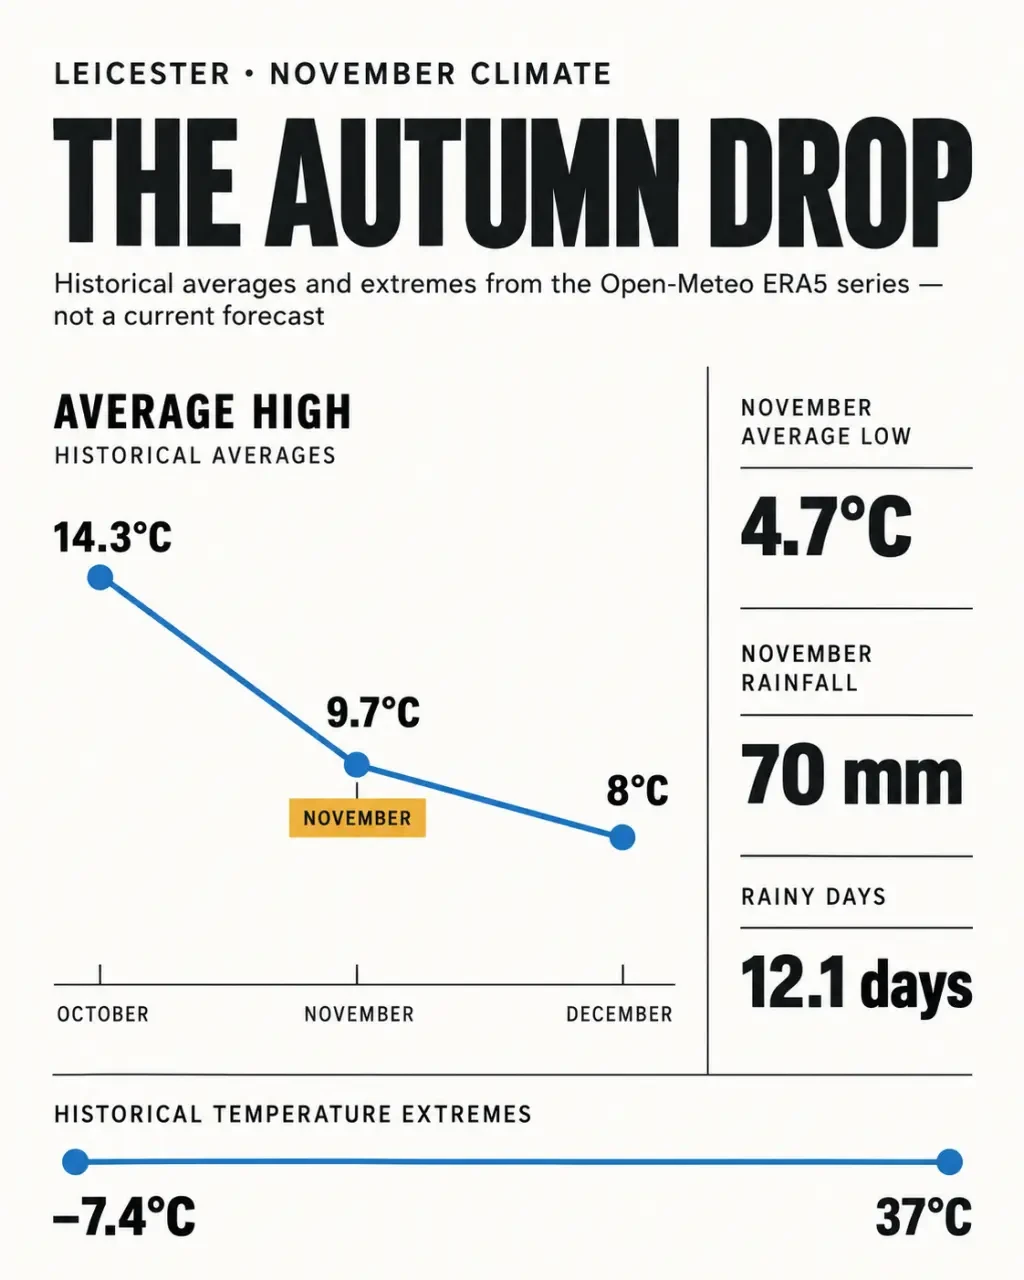
For November, the historical average high is 9.7°C, the average low 4.7°C, average rainfall 70 mm and rainy days 12.1, using the Open-Meteo.com ERA5 series covering 1 October 2016 to 30 September 2026.
November acts as a seasonal hinge: the average high falls from October’s 14.3°C to 9.7°C, before December’s 8°C. That transition makes October a poor temperature benchmark for a November outing; use the month-specific baseline, then check the forecast for the actual day.
Monthly highs and historical extremes
In the same series, average highs are January 6.7°C; February 8.6°C; March 10.4°C; April 13.1°C; May 16.8°C; June 20°C; July 21.9°C; August 21.3°C; and September 18.4°C.
The ten-year temperature extremes were 37°C and -7.4°C. September 2026’s average high was 20°C, a difference of 1.6°C above its monthly average. These historical comparisons describe Leicester’s temperature range, not the weather expected on your next visit.